
Some context on the topic: I have been running an interest group at our program since 2023. We host our flagship event, LogicLooM during every fest. The focus of our initiative is more on problem-solving and critical thinking, moving away from pure coding, AI, or ML competitions or hackathons.
One of the biggest challenges as an organizer is designing an evaluation format that can identify deserving winners while keeping the problems accessible, requiring no prior domain knowledge and still being fun to solve.
For the 2.0 iteration, I proposed a “Creativity Round”. Instead of testing factual, recall or standard formulas, participants were given an enclosed environment with documentation, videos, papers and articles directly on the quiz screen, since screen navigation was not allowed. They had to use these resources to solve these subjective questions. We reduced the number of questions from 25 to 15, removed negative marking for wrong answers and increased the time available per problem so that participants had enough time to think and solve properly. Also, it would’ve been sad if they skipped questions that took us a month to create :)
Analyzing the logs from 344 round-1 participants in LogicLooM 2.0 and 212 in 1.0, revealed an interesting disconnect between how students perceive difficulty, how they approach the problems, and what actually seems to measure problem-solving ability.
The Disconnect Between Perceived Difficulty and Actual Performance
Participant feedback showed a major shift in perceived difficulty. The first edition, which relied quite a lot on prior factual knowledge and calculations, with questions from statistics and mathematics, received a difficulty rating of 4.3 out of 5.
In 2.0, we removed much of the need for prior knowledge and provided the necessary resources directly in the Creativity Round. The perceived difficulty dropped to 3.0.
However, the score data tells a different story. Despite the round feeling significantly easier, overall scores dropped quite a lot in the 2.0 edition.
Participants may have felt more confident because the answers were, in some form, “in the room” with them. But finding the relevant information, understanding it, and using it to arrive at an answer turned out to be harder than simply recalling something they already knew.
The feedback revealed another interesting aspect of the new format: 53% of participants reported facing difficulty completing the round within the allotted time. Reading, interpreting, connecting information across sources and formulating an answer took considerably more time than simply recalling or applying a familiar concept. The challenge shifted from “Do you know this?” to “Can you find, interpret, and apply it in time?”
The Experiment: Forcing Out-of-the-Box Thinking
In traditional competitive events, questions are often binary: you either know the answer or you don’t. We wanted to test problem-solving and adaptability instead. We divided participants into Category Beginner (B) and Category Intermediate (I) and introduced a locked-down quiz environment. Participants were given necessary resources directly on the screen and had to use them to derive their answers.
The evaluation included auto-graded questions such as MCQs, short string matches (MSQs, short one- or two-word answers), numerical ranges, and manually evaluated subjective questions.
The Comfort Zone: Students Still Prefer MCQs
Looking at the attempt rates by question type across both categories, a clear trend emerges: participants tend to gravitate towards what is familiar.
Students clearly preferred the safety net of at least a 20% chance of guessing correctly (some MCQs questions had more than four options) over the effort of formulating a unique answer from scratch.
-
MCQs dominate: Multiple Choice Single Correct (
MCQSINGLECORR) questions had the highest attempt rates, around 80–85% for both categories. -
Manual evaluation is intimidating: Open-ended, subjective questions (
MANUALEVAL) had lower attempt rates, especially in Category “B” (~55%). -
Interestingly, Category “I” participants were more willing to attempt manual questions (~68%) than Category B participants.
When we break this down per question, there is some variance. For instance, in Category “B”, manual problem no. 14 (where we deliberately removed the hint) was attempted by barely 35% of participants, while MCQs consistently stayed above 80%.
Effort vs. Accuracy in Auto-Grading
When students could not rely on MCQs, their accuracy dropped significantly.
The accuracy charts for auto-gradable questions showed that Exact String Matches and Range questions were generally the hardest for both groups.
We studied the length of answers in the manually evaluated questions. Higher word counts did not necessarily mean better performance. Category “B” students generally wrote much longer answers, while Category “I” students often kept their answers concise. The auto. vs. manual score scatter plot showed a slightly steeper positive trend line for Category “I”, suggesting that their concise answers were often more effective.
Subjective Question is Definitely a Better Predictor
We looked at participants who performed strongly in last year’s prelims and checked how many of them progressed through the other rounds (these are usually coding related rounds) and eventually became finalists. We then made the same comparison for participants with top scores in 2.0.
This time, a larger proportion of the high performers progressed to the finals. Participants who scored highly in 2.0 prelims were represented among the eventual finalists at a meaningful rate.
Shaking Up the Leaderboard
Plotting previous-year percentile ranks against this year’s percentile ranks revealed several distinct participant journeys. While some participants stayed in the “Consistent Top” or “Consistent Low” sectors, the new format caused significant movement.
-
Emerged: Several Category “B” participants who were in the bottom 20th percentile last year moved up to the 70th and 80th percentiles this year. This may also be an effect of creating different level-wise paper pools this time :)
-
Declined: Conversely, several participants, heavily from Category “I”, who were in the 80th+ percentile last year dropped below the 40th percentile.
This shift was also visible when tracking last year’s Top 10 performers in a bump chart. The change in format clearly disrupted the previous leaderboard.
Conclusion
Introducing a creativity round in LogicLooM gave us some useful pedagogical insights. Making students read documentation, watch reference videos, and write out their logic is valuable. The data also suggests that this format can measure problem-solving ability in a different way from traditional auto-graded questions.
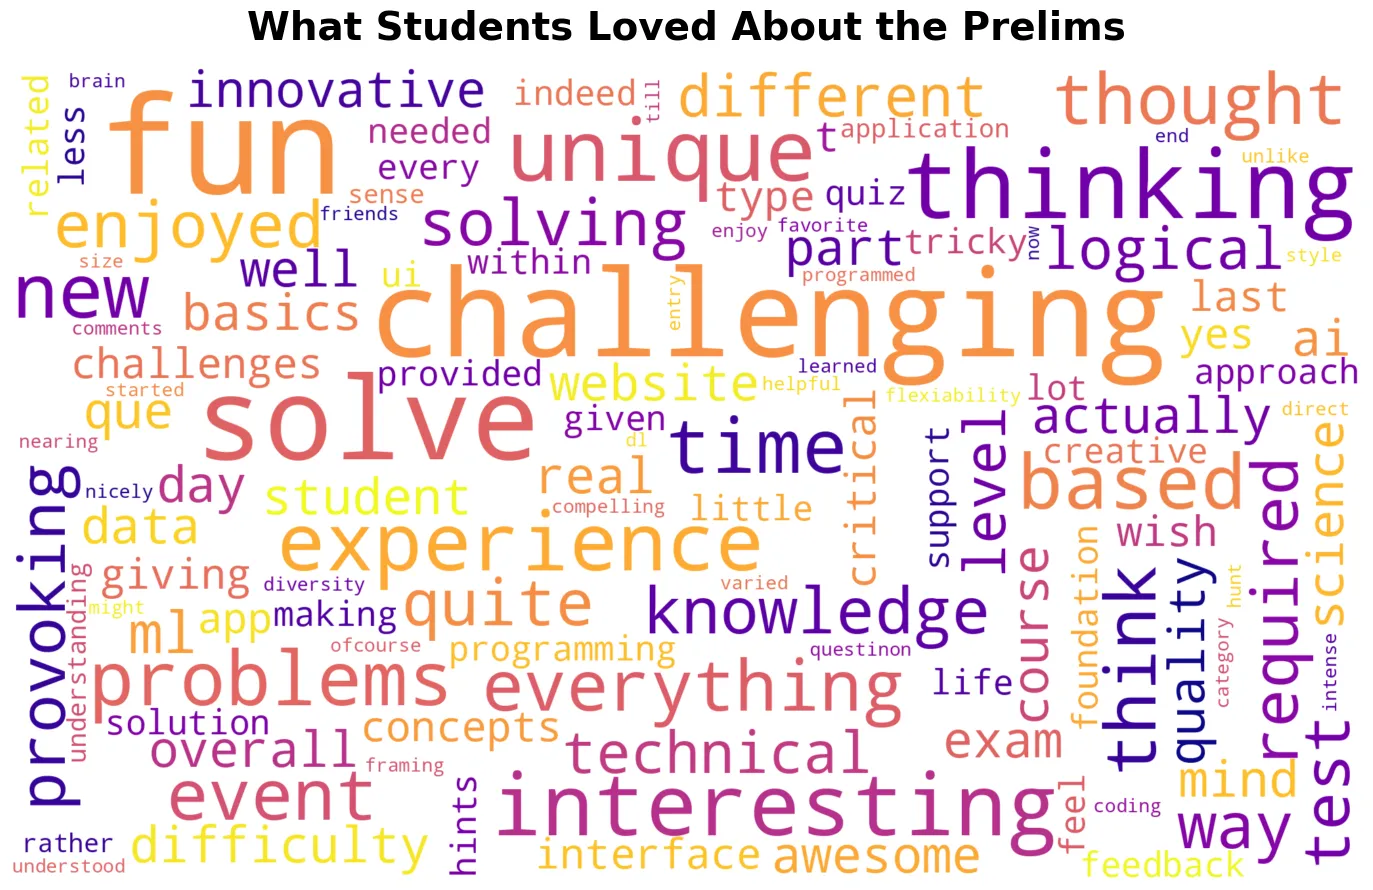
The new format was also very well-received. We maintained a high overall satisfaction rating of 4.1 on a 5 pt. scale, with 94% of returning participants explicitly stating that they loved the new changes. Here’s a wordcloud generated from the responses to one of the feedback form questions.
We did sacrifice some of the neatness and convenience of auto-grading, but gained a format that was more engaging and better suited to testing the kind of critical thinking and adaptability we wanted to see.
There is still a lot more analyses to do, though. I plan to create an interactive dashboard once we have more data from a few more editions, so that we can explore these patterns across multiple editions in more detail.